DEXTOOLS’ DASHBOARD
A crypto-analyzing sytem
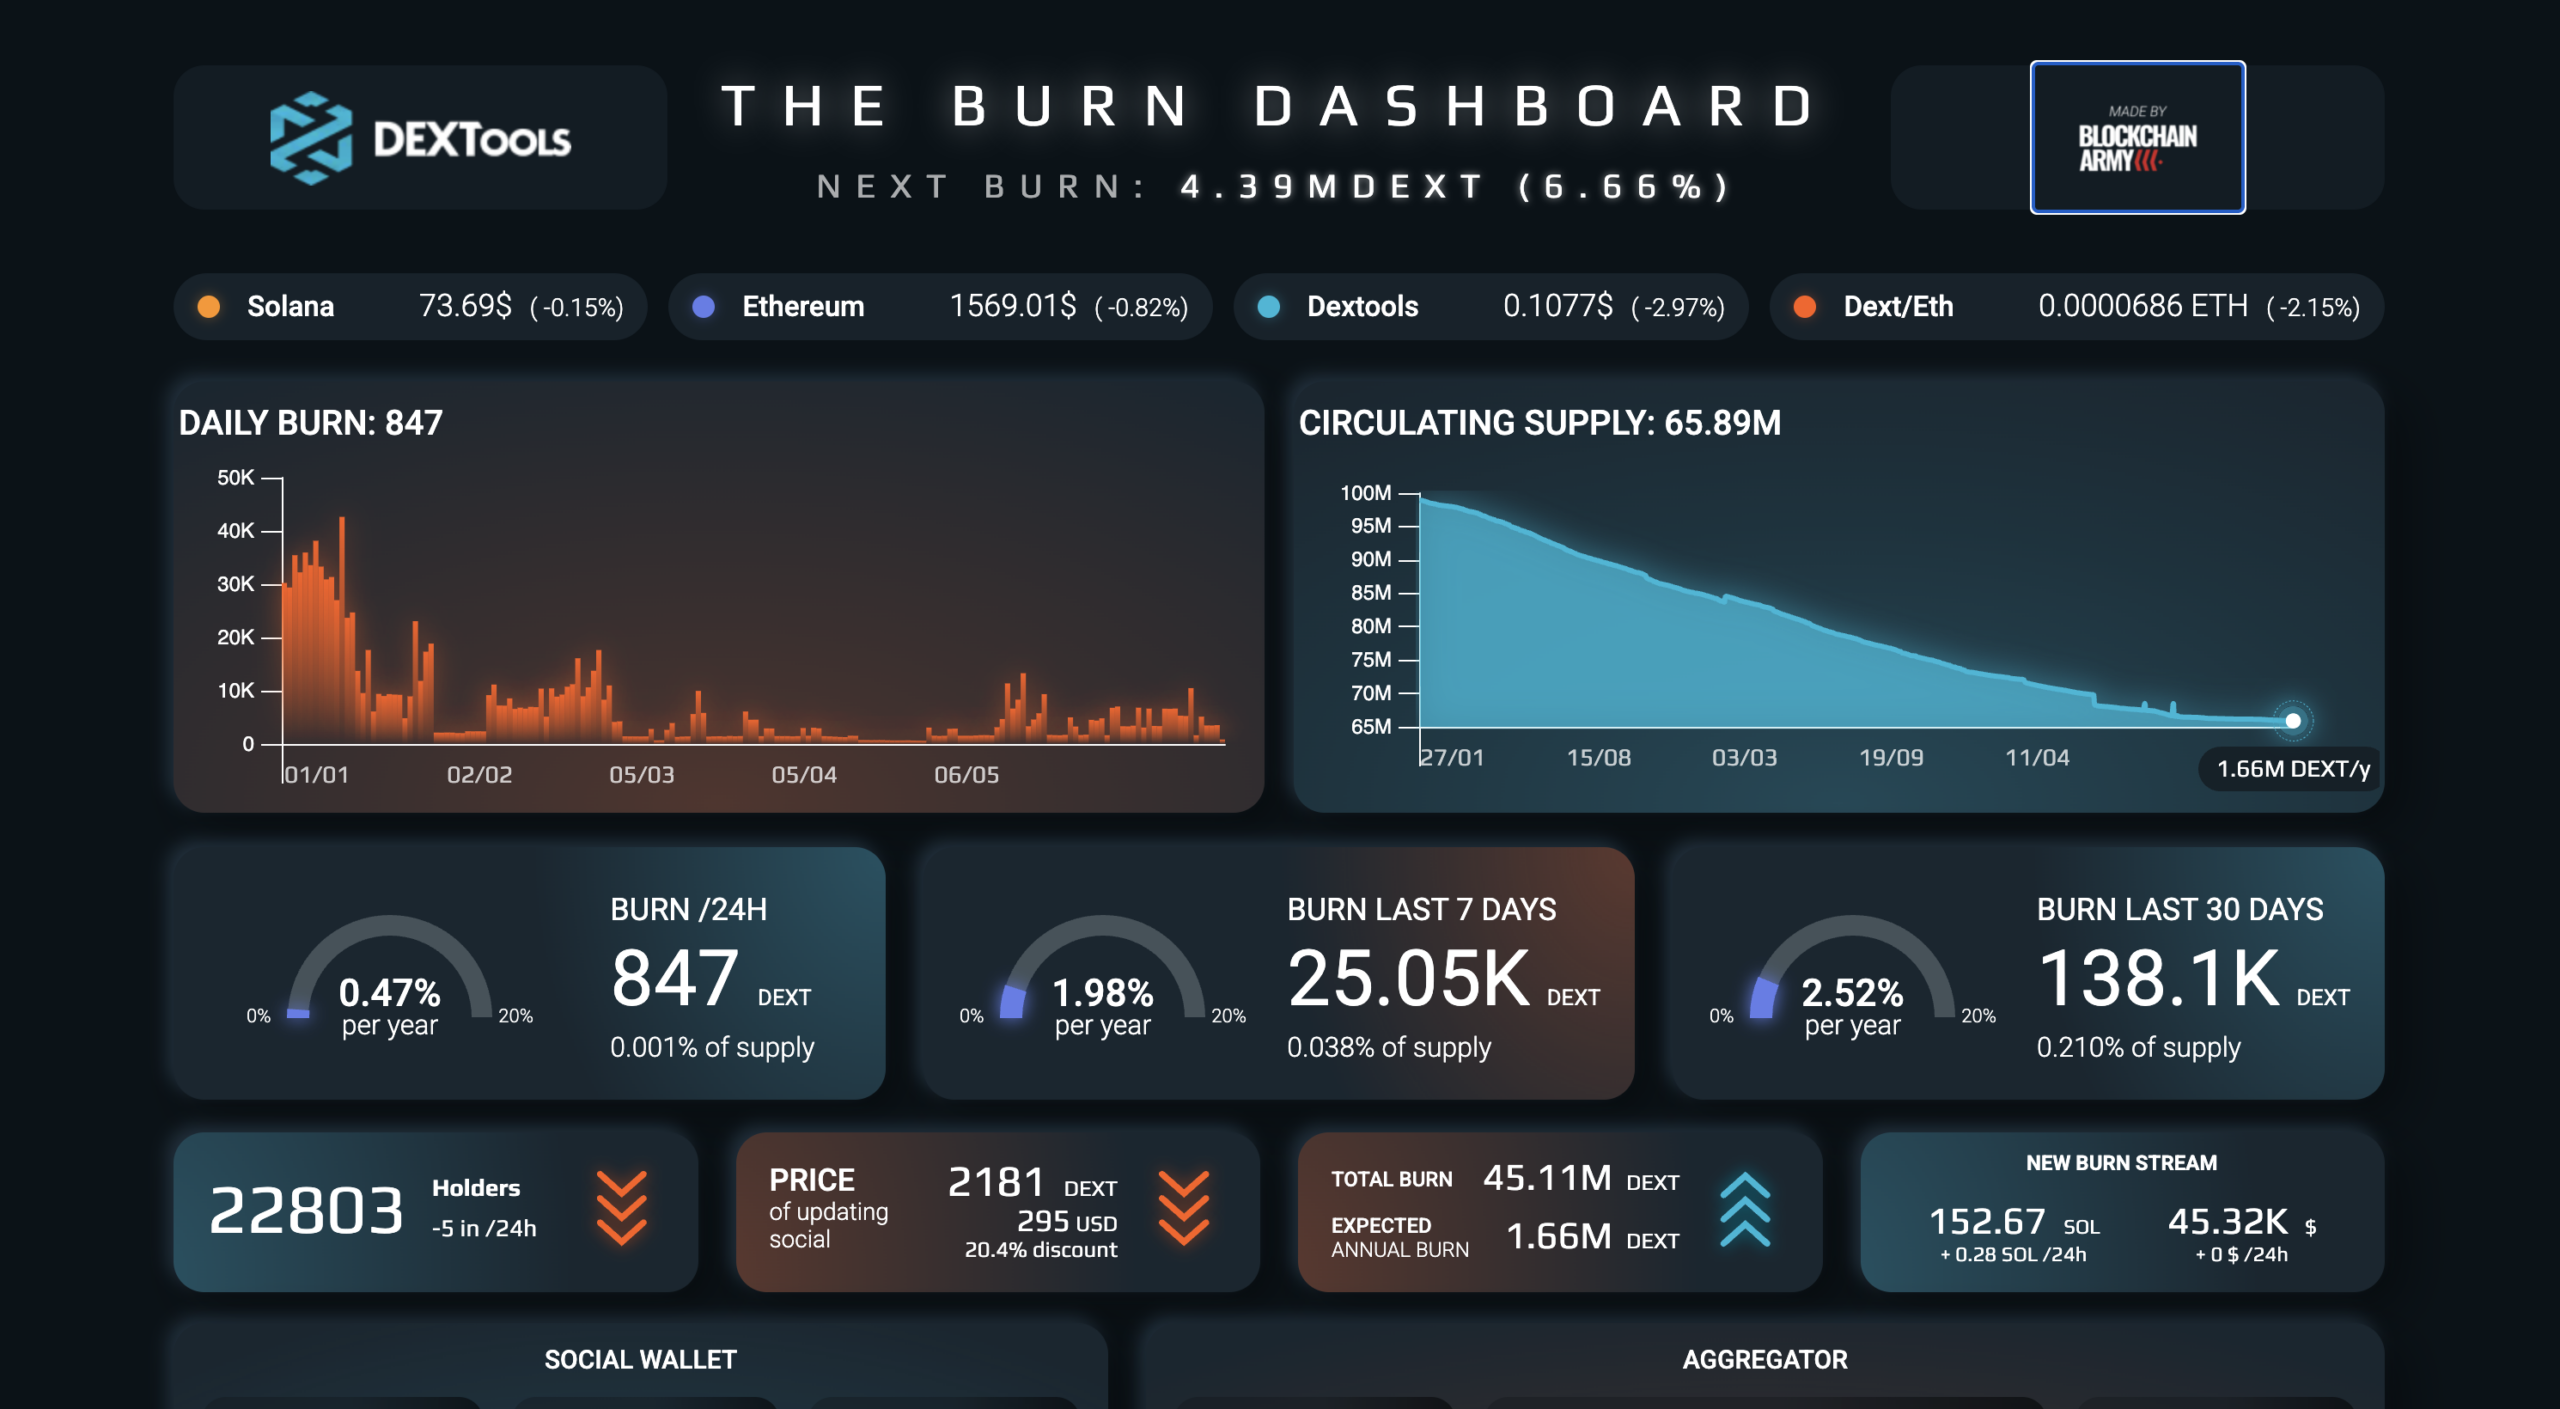
The DEXT Burn Dashboard is a real-time dashboard for DEXTools’ DEXT token, one of the most widely used DeFi analytics platforms in the world. The goal was to design a clear, data-dense interface that remains immediately readable, capable of communicating complex financial statistics — burn rate, circulating supply, aggregator wallets — in a way that’s accessible even to less technical users.

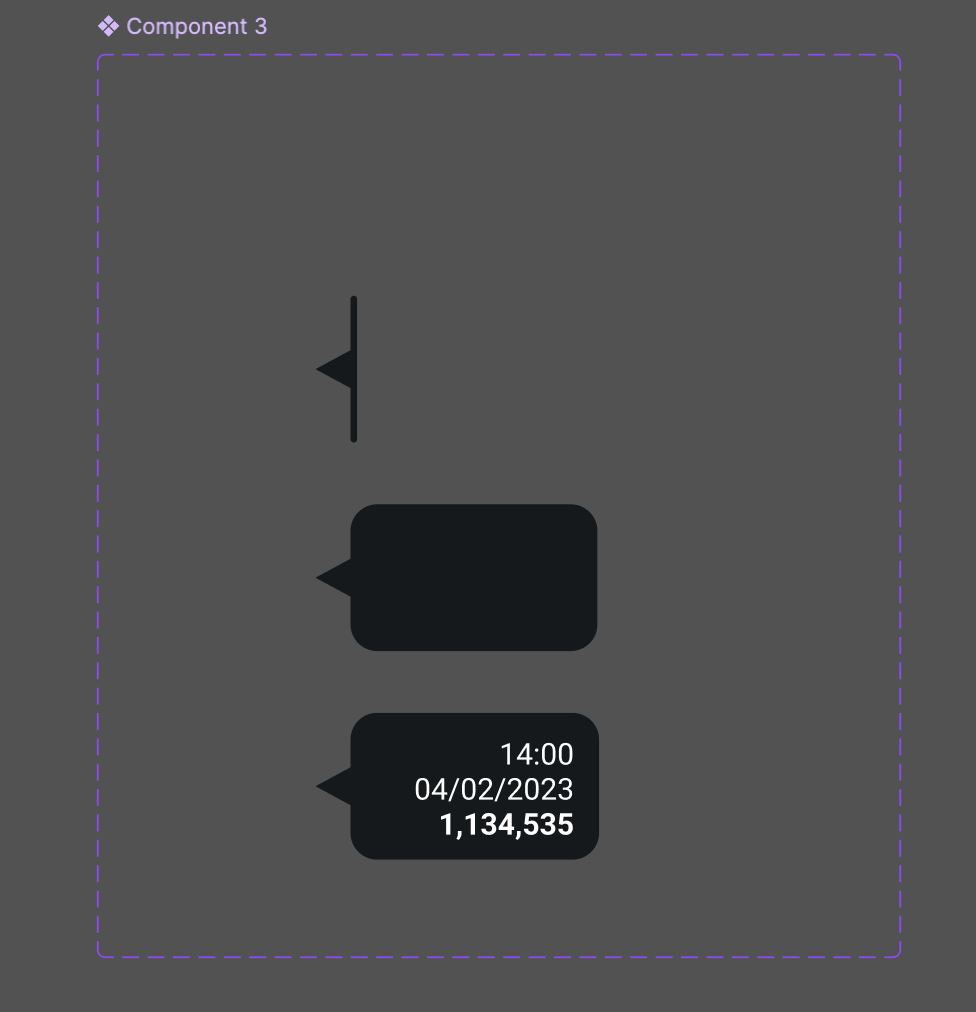
I started the project in Figma with a thorough analysis of the existing DEXTools brand: logo, official color palette, and the visual tone of their main interfaces. Before designing any single component, I built a shared styles foundation — colors, typography, spacing system — to ensure consistency across every section of the dashboard.
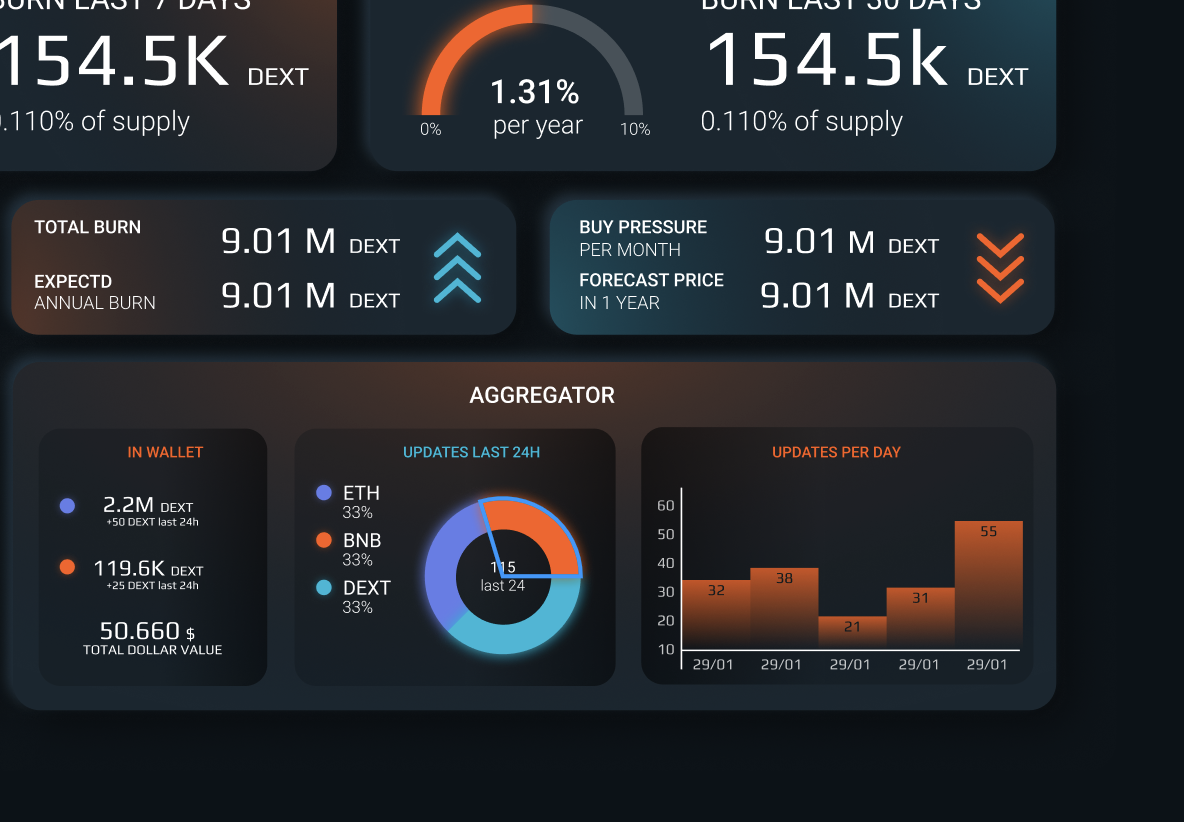
The page structure was designed with a top-down hierarchical approach: the most urgent and strategic information (Next Burn, Daily Burn, token price) occupies the top and visually dominant area, while aggregated data and wallet details flow progressively downward. This mirrors how a trader or token holder actually reads information: macro data first, details second.
The palette revolves around a deep dark background — near-black with dark blue undertones — which is the visual signature of DEXTools and the DeFi world at large. This choice isn’t purely aesthetic: a dark background reduces eye strain during extended monitoring sessions, and is the established standard in professional trading tools.
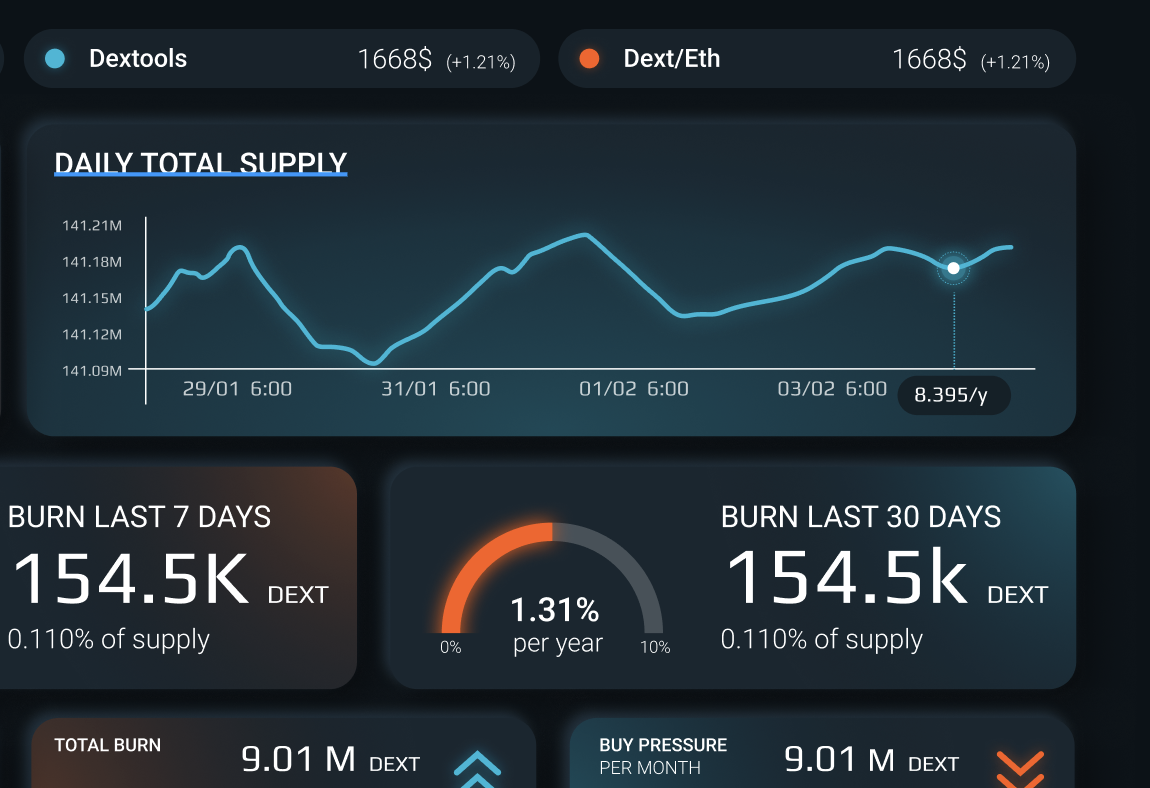
DEXTools’ orange/amber accents were preserved and enhanced as the primary action color and highlight, creating strong, readable contrast on the most important numerical data. Pure white was reserved exclusively for key figures and section titles, while mid-range grays handle secondary labels — a gray scale that naturally guides the eye without cluttering the reading experience.
Every decision was made in strict alignment with DEXTools’ visual identity: the logo is positioned top-left linking back to the main platform, the real-time price tickers replicate the style of the info bars already present across the platform, and the overall tone is that of a professional, reliable, no-frills tool — exactly what daily DEXTools users expect.
The result is a dashboard that doesn’t feel “external” to the product, but rather a natural extension of it: same visual grammar, same information hierarchy, same respect for data density without sacrificing readability.
Linkedin
Globe
Instagram
